Ongoing Wars · Selected record
Loading ongoing conflict reports from /api/incidents…
Loading Leaflet 2D map…
Markers are live records with real source coordinates from /api/incidents (earthquakes, thermal anomalies, disaster alerts, EONET events). Tiles: © OpenStreetMap contributors. The 3D globe above is unchanged.
Manually maintained registry of ongoing conflicts, organised by country and region. Not live data — every entry shows its sources and the date it was last manually verified.
This page is a manually maintained registry. It is not live or real-time data, and no API feeds it. Each entry was checked against the public sources below on 5 November 2026, and the registry only changes when the editor updates it.
Status labels. The Council on Foreign Relations (CFR) public dashboard labels situations Worsening, Unchanging, Improving or Developing. This site maps those to Escalating, Active, De-escalating and Monitoring. Disputes and confrontations without active fighting are shown as Monitoring even when the source label is unchanged.
Confirmed vs news-reported. “Confirmed listing” means the conflict appears in the public trackers cited. It does not verify individual events, and no casualty figures or event dates are published here. News-reported developments are not added as registry entries.
Sources. CFR Global Conflict Tracker · International Crisis Group — CrisisWatch · ACLED Conflict Monitors · Global News Map · Conflict Tracker
Records from /api/incidents. Every record carries a category, generalised location where supplied, verification status and source note. Locations are generalised and no real-time operational information is shown.
Publicly trackable aircraft only, from a configured aviation data source. No military aircraft positions are fabricated or displayed, and no position is shown without a source.
| Flight / callsign | Only when supplied by the source |
|---|---|
| Aircraft type | Only when supplied by the source |
| Origin / destination | Only when supplied by the source |
| Altitude / speed | Only when supplied by the source |
| Position | Generalised, source-supplied only — never estimated |
| Status | As reported by the source, with its timestamp |
Commercial, cargo and other publicly trackable categories, by region and altitude band. Filters apply to source-supplied records only.
Live aircraft from real feeds only. OpenSky is currently unavailable from this site's network; the regional ADS-B feed below is live and labelled separately. Counts are never merged, and no position is shown without a source.
Public satellite imagery, historical comparisons and NASA FIRMS fire / thermal-anomaly observations — clearly separated from confirmed damage assessments. Historical imagery is never presented as live.
Fire and thermal anomalies detected by satellite sensors (MODIS / VIIRS). An anomaly is an observation, not proof of a fire's cause or of damage.
| Observation | Thermal anomaly |
|---|---|
| Sensor / satellite | As supplied by FIRMS |
| Capture date & time | UTC, as supplied |
| Confidence | As supplied by FIRMS |
| Location precision | Sensor footprint — generalised |
Before / after pairs use imagery with a stated capture date for each frame. No frame is labelled "live". Comparisons are illustrative of change over time, not real-time monitoring.
Publicly documented infrastructure damage assessments are shown only when a credible assessor has published them, with assessor, method and date. A satellite observation alone is never presented as a confirmed damage assessment.
Breaking news, conflict developments, diplomacy, humanitarian updates and international security — from credible public sources. Cards below come from /api/news where available; developing or unverified reports are marked as such. While that feed is unavailable this page shows an unavailable state, not invented headlines.
Records from /api/incidents in chronological order. Select a date range or category to narrow the view, then open any record for its full report, sources and verification status.
Historical statistics from manually downloaded public datasets, stored as local files with this site. Nothing on this page is live or real-time data, and no API feeds it. Every figure is labelled with its own source and year. Last updated: 5 Nov 2026.
Each figure carries its own source and year. Figures from different sources are never added or averaged together.
These are the processed local files behind the charts above (JSON for the page, CSV for reuse). The raw bulk downloads stay in the project workspace and are not served. All files were downloaded on 5 Nov 2026.
What this page is. A historical statistics page built from public datasets that were downloaded once and stored as local files with this site (the backend). The page loads those files from the same site; it makes no live calls to the sources at runtime, and nothing here is real-time data or a current estimate.
Sources and publication details. (1) Uppsala Conflict Data Program (UCDP), Battle-Related Deaths Dataset, conflict-level, version 26.1, ucdp.uu.se/downloads, data years 1989–2025, CC BY 4.0. (2) Our World in Data, War and Peace graphers (deaths in state-based conflicts by region; deaths in armed conflicts by country; number of armed conflicts), ourworldindata.org/war-and-peace, data years 1989–2025, CC BY 4.0. (3) Stockholm International Peace Research Institute (SIPRI), Military Expenditure Database 1949–2025, file version 1.2, sipri.org/databases/milex, constant 2024 US dollars. (4) World Bank, World Development Indicators, Population total (SP.POP.TOTL), data.worldbank.org, file vintage last updated 2026-10-08, data years 1960–2025, CC BY 4.0. (5) Institute for Economics & Peace (IEP), Global Peace Index 2026 edition, visionofhumanity.org/maps, data years 2008–2026, IEP non-commercial licence. All files downloaded 5 Nov 2026; page last updated 5 Nov 2026.
Historical vs current. Every series is historical. The latest complete year differs by source (UCDP 2025, Our World in Data 2025, SIPRI 2025, World Bank 2025, Global Peace Index 2026) and is printed on each figure. Our World in Data 2026 rows are excluded because OWID states 2026 data is incomplete (first half only).
Definitions are not mixed. Each chart shows ONE source's metric under that source's definition. UCDP battle-related deaths (battle deaths per conflict-location-year) and Our World in Data conflict deaths (deaths of combatants and civilians due to fighting, based on where they occurred) are different measures and are shown in separate panels, never added, averaged or plotted on one axis. SIPRI figures are military expenditure in constant 2024 US dollars; World Bank figures are total population; GPI scores run lower = more peaceful.
Missing data. A missing value (SIPRI "…", IEP -1 codes, absent country-years) is shown as "data unavailable" and excluded from that chart only. It is never shown as zero and never estimated. Countries that are not in this site's country directory still appear in global totals and in unfiltered lists, but not under a region filter; the region panels state how many such locations were excluded.
Regions for filtering. The Year, Region and Country filters use this site's country directory regions (Africa, Asia, Europe, North America, Oceania, South America), matched by country name. Source-native groupings (SIPRI regions, UCDP regions, OWID regions) are preserved in the downloadable files and are not remapped.
If a dataset is unavailable. If a local file cannot be loaded, its panels show an "unavailable" message instead of figures. No panel ever shows invented statistics.
Complete directory of 195 UN-recognised countries (193 UN member states and 2 observer states). Names, capitals, regions and ISO codes are standard geographic reference data; country profiles also show live World Bank data via /api/country and live records via /api/incidents where available. Open a country on the map to centre the globe on it and open its profile, or open its full profile page.
General reference information about the Strait of Hormuz, plus a live vessel map embedded from Strait Up Maritime, manually verified incident reports, and published shipping statistics. This site runs no live AIS feed of its own — no vessel positions or transit counts are measured here.
Live vessel map by Strait Up Maritime, embedded here with the provider's own published embed code and credit link. The provider's map refreshes every 60 seconds (positions delayed about 60–180 seconds) and covers the public Hormuz bounding box only. This is the provider's live view, not a measurement taken by this site.
Centre: —
Select a port, a sample vessel marker, a country label or the shipping-lane label on the map, or a port in the Ports reference list below, to see its details here.
The Strait of Hormuz is the narrow sea passage between Iran to the north and Oman (the Musandam Peninsula) and the United Arab Emirates to the south. It connects the Persian Gulf with the Gulf of Oman and the Arabian Sea, and is about 33 km (21 miles) wide at its narrowest point, with inbound and outbound shipping lanes each about 3 km wide.
Public reporting commonly describes the Strait as one of the world's most important energy and shipping chokepoints: a large share of globally traded petroleum liquids and liquefied natural gas (LNG) passes through it, because the oil- and gas-producing states on the Persian Gulf have few practical alternative export routes by sea. Disruption, closure threats or incidents in the Strait are therefore widely reported as a global energy and shipping risk.
Neighbouring countries: Iran (north shore), Oman (Musandam Peninsula, south shore) and the United Arab Emirates (south shore, west of Oman). The passage is used by merchant shipping of many flag states; its legal regime and any security arrangements are matters of public international law and public reporting, not live data on this page.
| AIS / vessel feed | Not connected — no live AIS data |
|---|---|
| Live transit count | Not available — no live count is connected |
| Transits (24h) | — No live AIS feed |
| Oil tankers (24h) | — No live AIS feed |
| LNG carriers (24h) | — No live AIS feed |
| Strait status | — No live AIS feed (status not supplied) — sample status only, not a live assessment |
| Last updated | — No live AIS feed |
| Sample vessel | Type | Direction | Generalised area | Sample time (UTC) | Status |
|---|
Ports in and near the Strait. Selecting one centres the detailed map on it and opens its details. No live berth, schedule or vessel data is shown for any port.
World Conflict Tracker aggregates publicly available information from third-party sources into one map-first view of conflicts, reported military incidents, aircraft activity, satellite observations and international news.
An informational resource for exploring publicly reported geopolitical events. It is not a source of classified military intelligence, and it does not provide guaranteed real-time tracking.
It does not publish operational real-time missile trajectories, targeting information, sensitive military positions, or precise real-time impact coordinates in active conflict areas. Locations are generalised, publication is delayed where safety requires it, and every record carries its verification status.
This build loads statistics, incidents and headlines from the site's own /api/* feeds where available. Unavailable feeds are labelled as such and are never filled with sample data.
World Conflict Tracker monitors publicly reported conflicts and geopolitical developments around the world: earthquakes from the USGS, disaster alerts from GDACS, natural events from NASA EONET, international news from UN News, and news mentions from GDELT (labelled unverified when that feed answers). The Active Conflicts section is a manually maintained registry (each entry shows its sources and last verified date), not a verified UCDP/ACLED directory, so the site claims no verified conflict counts and presents its conflict reports as reports, not as a verified directory.
Satellite intelligence comes from NASA FIRMS thermal anomaly observations for the Middle East and Gulf. A thermal anomaly is an observation only, never proof of a fire's cause or of damage. Aircraft positions come from public ADS-B data; the OpenSky primary feed is currently unavailable, so coverage is the separate regional adsb.lol fallback centred on the Gulf and Strait of Hormuz, labelled as regional and never merged into a global count. ADS-B coverage is incomplete and the site makes no military tracking claims.
All feeds run through the site's own Cloudflare Worker proxy. API keys, where a source needs one, live only as server-side Worker environment variables and never in page code. Each record carries its source, time and verification status; unavailable feeds stay labelled unavailable instead of being replaced with sample data.
If you spot an error in a manually maintained entry, use the Contact page and choose "Data source correction". Corrections are applied to the data files with a new verified date and labelled as corrections.
How data is sourced, verified and presented on this site — and what is required to connect each source. No API key is stored in this page: keys belong server-side, behind a backend proxy, never in frontend code.
| Source | Purpose | Status |
|---|---|---|
| ACLED | Conflict and political-violence event data — Open-tier account has no API access; a free-access request is awaiting a reply | Not connected |
| GDELT | Global news and event discovery — blog feed connected; DOC API currently throttled (HTTP 429) | Partially connected |
| NASA FIRMS | Fire / thermal-anomaly observations | Connected |
| OpenSky Network | Available public aircraft data — credentials set, but the feed is unreachable from Cloudflare's egress network | Unavailable |
| UN News (via the site's own feeds) | International news, statements, humanitarian updates | Connected |
| USGS | Earthquake event data | Connected |
| GDACS | Disaster alerts | Connected |
| NASA EONET | Natural events | Connected |
| UCDP | Historical conflict datasets used in Analytics (public downloads); API token requested, awaiting a reply | Partially connected |
Sources are checked against their own published data. Manually maintained entries — the Active Conflicts registry, the Strait of Hormuz incidents and statistics, and the Analytics datasets — are verified against the named source on the stated date and labelled historical, never live. Live feeds are labelled by the source that actually answered; unavailable feeds stay labelled unavailable and are never filled with sample data. Thermal anomalies are observations only, never proof of cause or damage. GDELT items are labelled unverified. Locations are generalised, and publication is delayed where safety requires it.
Every record stores its original source and URL, publication timestamp, event timestamp where known, last-checked / last-updated timestamp, location precision, verification status and notes. A social-media claim is never treated as confirmed without corroboration. Conflicting reports and corrections are shown transparently, and corrections are labelled as corrections.
Do not assume any API provides unrestricted or truly real-time data. Coverage varies by source, region and period; access may require an account, a licence or a paid tier; and feeds may be delayed. These limits are stated on the record and in the statistics strip wherever they apply.
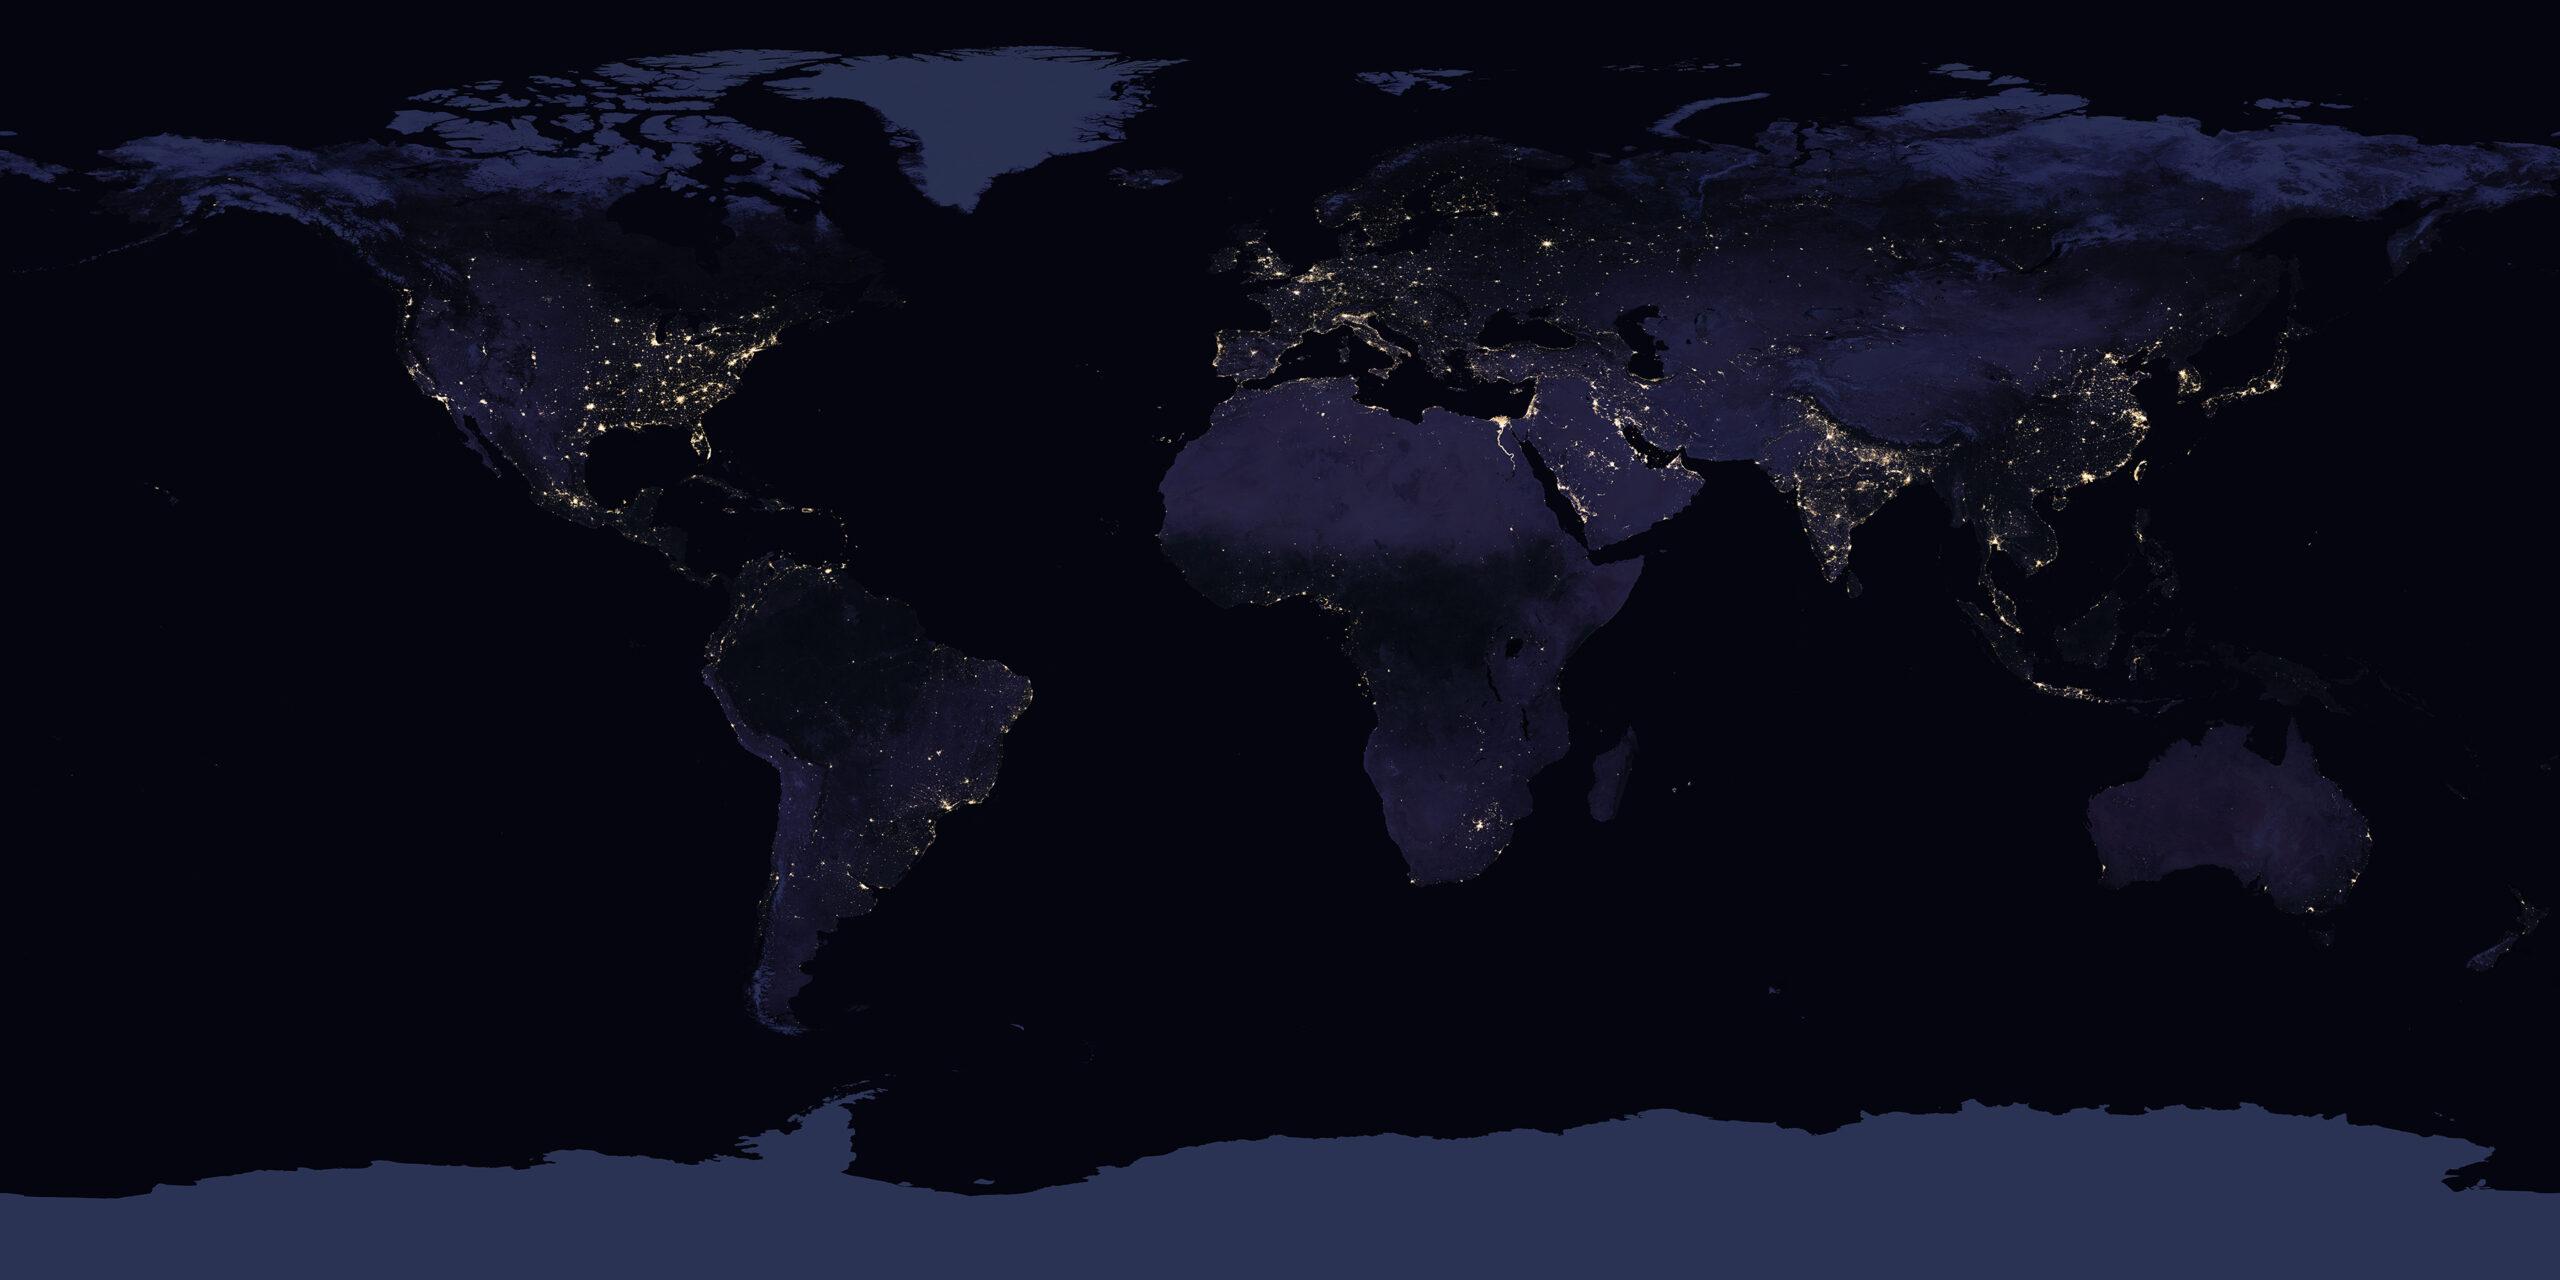
The centre view on the homepage is a CesiumJS 3D globe (WebGL) with its local imagery provider supplied up front, so it makes no Cesium Ion imagery request and uses no Ion terrain or Ion token. Its imagery is a local copy of NASA Black Marble 2016 night-Earth imagery (in assets/earth-night.jpg) served through a single-tile imagery provider, with an openly available Esri World Imagery tile provider loaded as an alternate layer and shown automatically if the local night imagery fails; the rendered canvas is checked repeatedly, and if Cesium stays black or loses its WebGL context the page switches automatically to a WebGL spherical globe built with Three.js and the same local image, labelled as the fallback, or to a visible message if no engine can draw. Country labels, markers, heat zones and the illustrative arc are drawn above the globe surface; locations are generalised to city level.
Messages cannot be sent from this page unless a backend is configured. Compose an inquiry below and download it as a text file to send through your own channel.
This page collects no personal data, sets no tracking cookies, and stores nothing you enter: the contact form only downloads a file on your own device. The centre globe's night-Earth image is served locally from this page's own files. Loading CesiumJS from its CDN, and the alternate Esri tile layer (shown only when Satellite Imagery is switched off), follow those providers' own request handling.
In a connected build, a privacy policy must state what account, usage and analytics data the backend collects, where it is stored, how long it is kept, and how to request deletion. Do not deploy a connected version without that policy in place.
Last updated: 4 November 2026.
World Conflict Tracker is an informational resource. Content is aggregated from third-party sources and may be delayed, incomplete or subject to verification. It does not provide classified military intelligence or guaranteed real-time tracking, and must not be relied on for safety-critical, operational or emergency decisions.
Unavailable feeds on this build are never filled with sample data, and sample data must not be republished as fact. Source material remains the property of its respective providers; follow each source's licence and attribution requirements when reusing it.
Last updated: 4 November 2026.